Just buy the index
Similar to stock indices, the SG CTA and SG Trend indices are composed of a diverse array of companies that do different things.

Similar to stock indices, the SG CTA and SG Trend indices are composed of a diverse array of companies that do different things.

The SG CTA and SG Trend indices are nearing their 25th anniversary. While CTAs have been providing their services for much longer, the introduction of these indices in 2000 significantly boosted the recognition of CTAs as an investment style. Despite not being intended as benchmarks, they’ve effectively become leading performance benchmarks for both CTAs and (potential) investors. In today’s investment climate, this naturally leads to the question: Can’t we just buy the index?
Whether it really was demand that triggered the supply, or well-marketed supply that seduced the demand, the fact remains: there are now various ETFs available, with managers — some more directly than others — claiming to offer CTA index returns. While we do not dismiss the possibility that these ETFs may deliver attractive long-term performance, and we fully recognize that their returns are highly correlated with the referenced index returns, we fundamentally reject the notion that these returns are the index returns. As we will further explore below, a general principle in investing is that index returns are not the result of aiming for them. It is similar to the idea that one cannot conceive an ‘average’ child.
Let’s start with the good news: the SG indices are designed to be investable. The broader SG CTA Index currently comprises the 20 largest CTA managers that, among other criteria, are open to new investments. Therefore, if an investor wishes, they could allocate 1/20th of their funds to each of the CTA programs in the index and rebalance these allocations according to the index schedule. Similarly, the SG Trend Index currently includes the ten largest trend following CTA managers, as determined by Société Générale, which also need to be open to new investments.
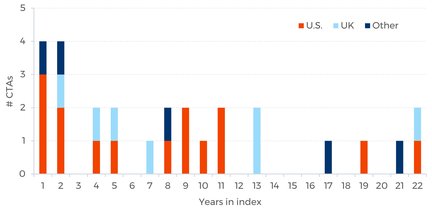
Just like most stock indices, the composition of the various SG indices changes over time. Each year, one or more components are replaced by others that often offer a slightly different investment style. There have always been different schools within the CTA universe, even among trend following ones. At its inception in 2000, the SG Trend Index consisted of ten programs offered by eight different CTAs, all from the United States. None of these initial constituents are still in the index. In 2024, the index consists of ten programs offered by ten different CTAs: four from the U.S., three from the UK, and three from continental Europe. Since 2000, 27 CTAs have been in the index with one or more programs, some for only a year, others for more than 20 years.

In the earlier years, a more restrictive criterion than being open to new investments was the requirement to report daily returns. Traditionally, CTAs offered their services primarily through managed accounts and often only reported monthly composite returns. Reporting daily returns was typically done for publicly offered funds. Our Diversified Trend Program (DTP) entered the SG Trend Index in 2004 with the Admiralty Fund, which was later replaced by the DTP – Enhanced Risk (USD) composite. Somewhat similarly, the British CTA that has been included in the index for the longest period — Aspect Capital — was initially represented by their Diversified Programme and later by their Core Diversified Programme. And the longest-included U.S. CTA — Graham Capital Management — has been represented by six different programs over time. But also the CTAs whose program names in the index didn’t change would likely argue that their strategies have evolved over the years. The CTA industry constantly changes, as does the world in which we operate.
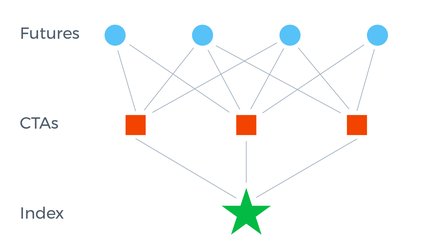
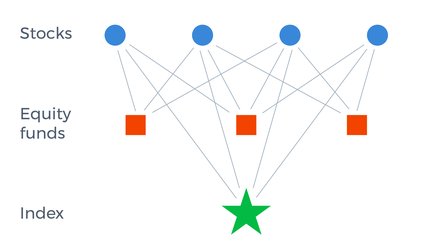
CTAs are investment managers who trade selected futures markets and often other derivatives like forward contracts. This in itself is largely comparable to equity funds that trade selected stocks. However, there is a fundamental difference between a CTA index and a stock index. A CTA index is a managers index, while a stock index is a markets index. In a stock index, the constituents are stocks chosen by the index composer. In contrast, a CTA index comprises the CTAs themselves, not the futures contracts they may trade. This means that the returns of a stock index are directly derived from the underlying stocks, regardless of the positions held by the largest equity funds. On the other hand, the returns of a CTA index are fully determined by the actual positions of the largest CTAs, as these returns are derived from the programs of these CTAs.


This difference has important consequences:
The returns of a CTA index are calculated after costs (market impact, commissions, fees, etc.), while the returns of a stock index are before such potential costs.
The largest equity funds as a group can outperform or underperform ‘their’ index. However, the group of the largest CTAs that make up the index cannot; their average performance defines the index performance.
And there is another important consequence. The strategy behind one of the ETFs that seeks to deliver the SG CTA Index returns (plus a cost benefit) is focused on replicating the positions of the CTAs that make up the index. If all components of the index were to do this, the index’s strategy would degrade to that of a dog chasing its own tail. If the largest equity funds were to simply buy the index (which they may already largely do), other market participants would still be able to give meaning to the index.
Instead of focusing on the differences between a stock index and a CTA index, we can also highlight their perhaps somewhat surprising similarities. We defined a CTA as an investment manager trading primarily in futures markets. However, futures contracts by themselves are rather meaningless. Their economic significance is entirely determined by the meaning of their underlying markets. At Transtrend, we are fully aware that we don’t just trade futures; we trade futures on aluminum, copper, bean oil, milk, the Japanese yen, the British pound, etc. We are active participants in these (underlying) markets, and we are not the only ones. Futures contracts are not listed to serve CTAs like us; CTAs exist to serve the participants in the underlying markets.
Who are these participants? Many of them are companies with listed stocks. For instance, car manufacturer Toyota trades in markets like copper and the yen, similar to Transtrend. Food producer Unilever trades in markets like bean oil, cocoa, milk and the British pound, just like Transtrend. Container carrier Maersk trades in markets like freight, diesel and the Norwegian krone, just as we do. The results of the economic activities of CTAs like us determine the returns of a CTA index. And the results of the economic activities in the very same markets of companies like Toyota, Unilever, and Maersk ultimately determine the returns of a stock index. There are, of course, also some distinct differences in this respect, but essentially a CTA index and a stock index are more alike than one might think.


Another similarity is the importance of diversification within the indices. The foundation for this is that an index comprises stocks of different companies that do different things. Toyota produces and sells cars, and it is very good at that; Unilever is very good at producing and selling consumer products; etc. Each company has its own edge. That’s exactly why we have depicted the indices in the illustrations above by a star — a shining star has many different edges!
No company has ever become successful by producing ‘the index’. That would mean a bit of car making, a bit of margarine and soap making, a bit of banking, etc. That just isn’t a competitive edge. If a company’s success is measured by its market cap, we should look at the largest components of for instance the S&P 500 or the Dutch AEX. We’ll see companies like Apple, Amazon, Microsoft and ASML. These companies didn’t succeed by replicating their predecessors. No, they chose to do something new, something different.
But when we look at some of the long-term successful components of the various stock indices, we also witness continuous change. Procter and Gamble aren’t making the same candles and soap they did around 1850. Coca-Cola didn’t start out with Minute Maid and vitaminwater. Johnson & Johnson didn’t stick to selling ready-to-use sterile surgical dressings. Whirlpool didn’t stick to making electric motor-driven wringer washers. And Dutch Philips didn’t stick to making electric incandescent light bulbs.
They all continued to move forward and often led the way. That’s what drives our economy: different entrepreneurial minds continuously exploring new directions. And investors can participate in this process, profiting from the successes of individual companies while being protected by the diversification that comes from the varied choices and strategies of these companies. The attractiveness of investing in a stock index stems precisely from this.
Why did we just spend four paragraphs on the virtues of diversification in a stock index in a story about trend following CTAs? Because we have no reason to believe that these same arguments wouldn’t hold for CTAs. Our industry may be perceived as offering an ‘alternative investment strategy’, but not so alternative that it wouldn’t obey the same economic laws and principles.
One of these laws is the necessity to continuously explore forward. As mentioned earlier, the longest-standing constituents of the SG indices have likely not employed the exact same strategy over the years. Just as Whirlpool no longer thrives by making electric motor-driven wringer washers. Brand names tend to outlast the products that originally defined them. It’s merely marketing that maintains the illusion that it would be the other way around.
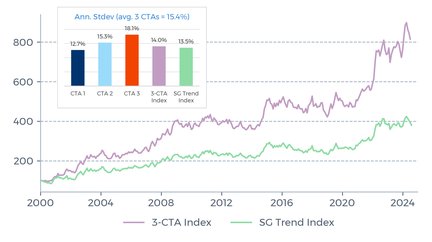
Speaking of long-standing: at a SocGen event earlier this year, I gave a presentation on this very topic. It included the chart below, which shows the return development if one had allocated in three equal parts to only the three longest-standing managers in the SG Trend Index. The immediate response from the audience was: “Just survivorship bias!”. And indeed, that certainly played a role. The same criticism applies when meeting centenarians at an old age home. However, one could also listen to these individuals to find out whether they made different life choices compared to most people who didn’t reach that age. Perhaps another lifestyle?

THE VALUE OF YOUR INVESTMENT CAN FLUCTUATE. PAST PERFORMANCE IS NOT NECESSARILY INDICATIVE OF FUTURE RESULTS.
For these veteran trend following CTAs — including Transtrend — some common choices seem clear. Beyond our focus on continually adapting our strategies, we have all three consistently embraced the virtues of diversification. This sets us apart from some of the CTA programs that remained popular for a much shorter period. When discussing different companies having different edges, diversification is undoubtedly one of our strengths. With DTP, we aim to deliver “the fruits of a diversified approach”, as we mentioned in our August 2023 article with the same title.
But that wasn’t the reason I showed this particular chart. The point was to see how much lower the volatility (measured by the annualized standard deviation of returns) of this 3-CTA combination was compared to the average volatility of the three individual programs making up this index. This outcome isn’t a symptom of ‘survivorship bias’. No, it’s explained by the diversification that results from dispersion. I explained that this doesn’t require mature CTAs, large CTAs, or programs in the index. It only requires different CTAs. And that means CTAs that see it as their duty to deviate from the index. The chart illustrates that even these three long-standing CTAs, despite their shared focus on diversification, are different companies making different choices. And it’s this diversification that drives the index returns.
This leads us to the question: How can an ETF that trades in fewer than 20 markets deliver CTA index returns? The answer is simple: it cannot. It may produce returns that are highly correlated with the index returns. And in that respect, it is no different from any other trend following CTA program, with a comparable amount of ‘single manager risk’. But it does not deliver the index returns. For that, it simply lacks the diversification that underpins these returns.
The index returns are the fruits of companies that aim to be distinctive rather than to bring the index returns.
The index returns are the fruits of companies that aim to be distinctive rather than to bring the index returns. For CTAs, this is no different than for other companies. Investors can only access the index returns by participating in these various companies. In the stock market, this can be achieved by simply buying the index, for instance through an index tracker. However, for the SG indices, such products are not readily available. Investors can only access the returns of these indices through direct allocations to the various underlying managers.
And that is precisely what many of our long-standing clients do. They allocate to various CTAs. Generally, they don’t invest in all constituents of the index; that’s not really necessary. And they also don’t limit themselves to only the index constituents; that wouldn’t be advisable either. To capture most of the index returns — that is, to benefit most from the diversification driving those returns — it seems most effective to allocate to the most distinctive programs. This could include some long-standing constituents of the index. But it definitely also includes programs that aren’t part of the index yet.
¹ Source: Société Générale, see also the description of indices used.
² Source: BarclayHedge & Transtrend. Data through July 2024. The 3-CTA index is calculated solely for this article and for illustrative purposes only. The 3-CTA Index is calculated by using the same methodology as is used for the SG Trend Index, which means that the index is equally weighted and rebalanced annually. For Aspect Capital and Graham Capital Management, the performance of the programs that have been included in the SG Trend Index for the longest period of time are used to calculated the 3-CTA Index (i.e., Aspect Diversified and Graham K4D 15V). For Transtrend, the composite performance figures of the Enhanced Risk (USD) subset of DTP are used, as described in the explanatory notes, which are an integral part of the performance data. For the SG Trend Index, please refer to the description of indices used.